

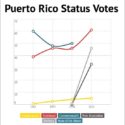
There have been five votes on Puerto Rico’s status in Puerto Rico. The results are shown below — and in the chart above. The tables below may seem a bit confusing, but read on to see a clear pattern.
July 23, 1967
- 60% Commonwealth
- 38.9% Statehood
- 0.6% Independence
November 14, 1993
- 48.6% Commonwealth
- 46.3% Statehood
- 4.4% Independence
December 13, 1998
- .06% Current territory status
- .1% Free association
- 2.5% Independence
- 46.5% Statehood
- 50.3% None of the Above
November 6, 2012
- Do you agree that Puerto Rico should continue to have its present form of territorial status? Yes: 46% No: 54%.
- Irrespective of your answer to the first question, indicate which of the following non-territorial options you prefer.
- Statehood: 61.13%
- Independence: 5.54%
- Sovereign Free Associated State: 33.32%
June 11, 2017
- 97% chose statehood.
- 1.52% chose independence
- 1.35% voted to stick with the current territorial status
In 1967, Commonwealth was the most popular option, gaining 60% of the vote. In 1993, Commonwealth received a slight majority. In both cases, Congress rejected the definitions of “Commonwealth” offered by Puerto Rico and refused to take action. In 1998, Commonwealth was not included, since it was pointless to include an option that would not be accepted by Congress. The Commonwealth party encouraged supporters to vote “None of the above” but of course there could have been voters who chose “None of the above” with something else in mind. Nonetheless, in the chart shown above we have included all votes for “None of the above” as votes for commonwealth.
The 2-part vote in 2012 also did not include Commonwealth, for the same reason. However, we have included votes in favor of continuing as a territory on the first question together with the territorial option from 1998. If we included those votes as votes for commonwealth, we would see Commonwealth continuing on a downward path.
Here’s the chart again:
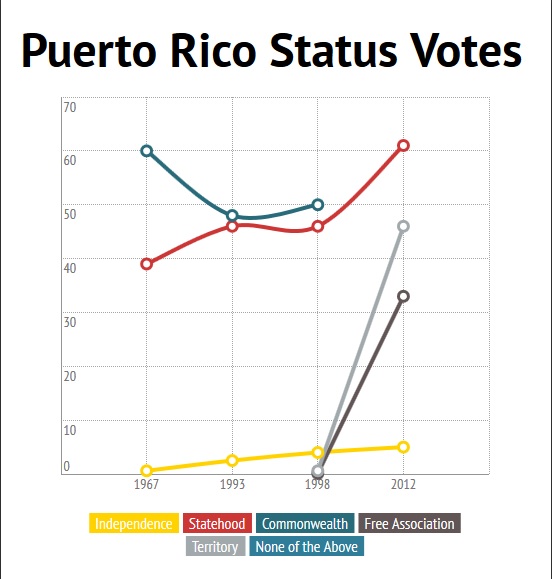
Independence rises slightly from 1967 to 2012, but continues to be favored by only a very small percentage of the voters.
Free Association and Territory rise, but not to the level of Statehood or Commonwealth.
Commonwealth falls.
Statehood rises, ending up with the highest percentage of votes.
The 2017 vote
In June, 2017, a fifth vote was held. In this vote, 97% of the voters chose statehood. Fewer than two percent voted for the current territorial option or for independence. Both the “commonwealth” and the independence party called for boycotts of the vote. As many observers noted at the time, nobody calls for a boycott of a vote they think they can win. Statehood clearly won. The chart above shows the growing popularity of statehood, and the final vote confirmed it.
This post was originally written in English and may be being auto-translated by Google.


8 Responses
[…] Rico has had several plebiscites voting on the status of the Island in relationship to the United States. Sometimes the idea of […]
[…] also has strong support for his idea that more and more people will favor statehood. The plebiscites that have been held in Puerto Rico have seen the desire for statehood increase, until the 2012 vote […]
[…] bill were adapted for a local referendum, the party helped convince 50.1% of the voters to vote “None of the Above.” Now he freely admits this tactic denied the people a vote to secure the rights that are possible, […]
[…] based on self-determination. In 1992, President Bush did the same. After several plebiscites with inconclusive results, the White House Task Force on Puerto Rico’s Status identified statehood or sovereign nationhood […]
[…] the most part, these are not calls for independence on the part of the people of Puerto Rico, whose votes in every referendum have shown that independence is not a popular option. These are calls for the United States to […]
[…] Rico has held four votes on the territory’s status. In 1967, 1993, 1998, and 2012, Puerto Rico’s voters chose […]
[…] will be the first federally-sponsored vote on status in Puerto Rico. Unlike the earlier votes, this one will include only options that the United States can accept. “Enhanced […]
[…] Rico: statehood or independence. Independence has not received more than 6% of the votes in any status referendum so […]